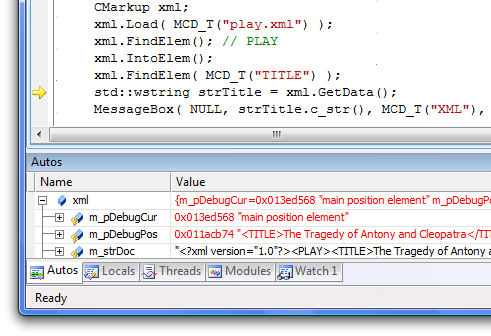
One of the typical difficulties with programming XML is not being able to see where you are in the document because it is hidden inside a component. CMarkup has two debugging members that automatically show you your current position in the document as you step over your CMarkup method calls.
Update March 24, 2009: with CMarkup release 11.0 the new debugging members m_pDebugCur and m_pDebugPos have replaced m_pMainDS and m_pChildDS to give a simpler and better view into the current position during debugging. They also work with the new file modes (see C++ XML reader and C++ XML writer).
As you step through your code you can watch the two m_pDebug data members to see where your current position is. The m_pDebugCur data member indicates the type of current position and m_pDebugPos spies into the document at the start of the element, node, or offset into the document. m_pDebugPos points right into the actual document string so you can inspect the current location plus anything that comes after it in the document up to the string length limit of your debugger's string view.

The m_pDebugCur string will be one of the following: top of document, main position element, main position node, parent position element, child position element, or (only in file mode) main position offset. Since the file modes are forward-only, you can have just an offset rather than a current element or node after IntoElem, OutOfElem, or a call to FindElem or FindNode that scans to the end of the containing element without matching the desired node.
If _DEBUG is defined, the m_pDebugCur and m_pDebugPos state members are included in CMarkup and updated on every method call that affects the current position. These are just string pointers so setting them has a negligible effect on the performance of your debug build. These debug state members do not exist in your release build.